Distribution Curves: How Math Can Actually Help You To Invest in Less Risky Stocks
When we invest in a company’s shares, we are making a long-term bet that the share price will rise over time.
But in investing, we never deal in absolutes but rather a range of probable outcomes.
This is where understanding the concept of a distribution of possible outcomes becomes useful.
Using what we know now, we can build a simple distribution model of long-term returns.
This will, in turn, guide us on whether a stock makes a good investment.
And if so, how much capital should we allocate to it.
Here are some common distribution model graphs and how they impact our investing decisions.
Note: these distribution curves are modelled based on our own analysis of the company.
Normal Distribution
This is the most common probability distribution curve.
Let’s assume that a stock is expected to double after 10 years.
The distribution curve for a stock with a normal distribution of returns will look something like this:

In this scenario, the highest probability is for the stock to return 100%.
There is also a chance that the stock can have lower or higher returns.
Narrower Distribution of Outcomes
There is also the possibility that a stock has a narrower distribution curve.

In this scenario, the variance of return for this stock is less.
This means it is less likely to deviate from the expected 100% return over the time period.
We can say that this stock is less risky than the first one.
Each stock may exhibit different degrees of the normal distribution curve.
The thing to keep in mind here is that the taller the peak, the lower the variance and vice versa.
So a very flat curve will mean the stock has a high variance of returns and is riskier.
Bimodal Distribution
There are also stocks that have a bimodal distribution.
This means that there are two peaks or two likely outcomes along with a range of other outcomes that cluster around the two peaks.

In the above example, the stock’s returns cluster around two peaks, -80% and +300%.
The numbers are arbitrary and are just numbers I picked randomly.
The point I am trying to make is that bimodal distribution can occur when there are two distinct possibilities that can either make or break a company.
A useful example is a biotech stock that requires FDA approval to commercialise its product.
If it succeeds in getting FDA approval, the stock can skyrocket.
But if it is unable to get the regulatory green light, it may run out of money and the stock price can fall dramatically.
How to Use Probability Distribution Curves?
We can use a probability of outcomes distribution model to make investment decisions for our stock portfolio.
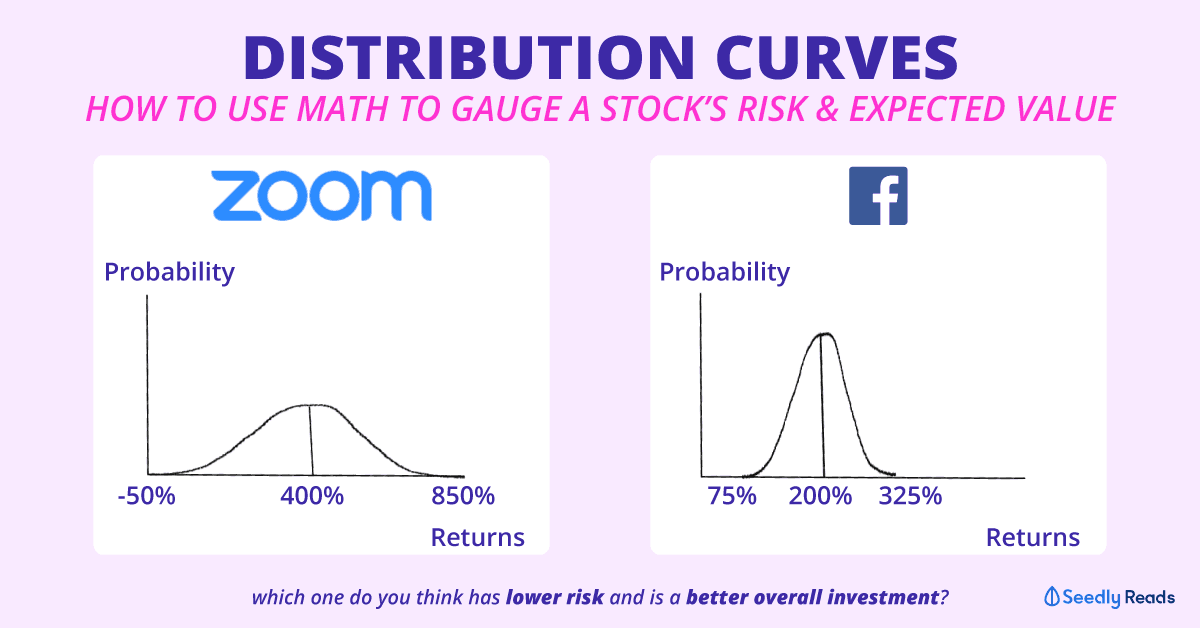
For instance, you may calculate that a stock such as Facebook Inc (NASDAQ: FB) has a 10-year expected return of 200% and has a narrow normal probability curve.
This means that the variance of returns is low and it is considered a less risky stock.
On the other side of the coin, you may think that a stock such as Zoom Video Communications (NASDAQ: ZM) can exhibit a normal distribution curve with a modal return over 10 years of 400%.
But in Zoom’s case, you think it has a wider variance and a flatter distribution curve.
In these two scenarios, you think Zoom will give you better returns but it has a higher probability of falling short and a much fatter tail-end risk.

With this mental model, you can decide on the allocation within your portfolio for these two stocks.
It won’t be wise to put all your eggs into Zoom even though the expected return is higher due to the higher variance of returns.
Given the higher variance, we need to size our Zoom position accordingly to reflect the bigger downside risk.
Similarly, if you want to have exposure in stocks with bi-modal distribution.
We need to size our positions with a higher risk in mind.
Some stocks that I believe have bimodal distribution curves include Moderna, Novocure, Guardant Health and other biotech firms that are developing novel technology but that have yet to achieve widespread commercialisation.
Portfolio Allocation
As investors, we may be tempted to invest only in stocks with the highest expected returns (ER).
This strategy would theoretically give us the best returns.
But it is risky.
Even diversifying across a basket of such high variance stocks may lead to losses if you are unfortunate enough to have all these stocks end up below the ER you modelled for.
Personally, I prefer having a mix of both higher ER stocks and stocks that have slightly lower ER but lower variance profile.
This gives the portfolio a nice balance of growth potential and stability.
This article first appeared on The Good Investors and is part of a content syndication agreement between The Good Investors and Seedly.

The Good Investors is the personal investing blog of two simple guys, Chong Ser Jing and Jeremy Chia, who are passionate about educating Singaporeans about stock market investing.
If you have any questions about this stock and other stocks in general, why not head over to the SeedlyCommunity to discuss them with like-minded individuals?
Disclaimer: The information provided by Seedly serves as an educational piece and is not intended to be personalised investment advice. Readers should always do their own due diligence and consider their financial goals before investing in any stock.
Advertisement

