How to Read Financial Ratios & Identify Great Stocks Part 2: P/B and P/E Ratio & Liquidity Ratios

You may have seen our community members discussing investments on Seedly and seen the terms price-to-book (P/B) Ratio and price-to-earnings (P/E) ratio being thrown around.
But what are these ratios, and what do they show?.

Fret not, because we will explain them below.
In this post, we will continue with the second part of the must-know financial ratios to analyse a stock, using Starhub (SGX: CC3)’s financials in 2018 as an example.
If you haven’t read the first part, you can check it out here.
Similarly, we will be analysing Starhub (SGX: CC3)’s and Singtel (SGX: Z74)’s financials in 2018 for this example.
Disclaimer: This post may get pretty technical, but we will try to break it down into digestible pieces!
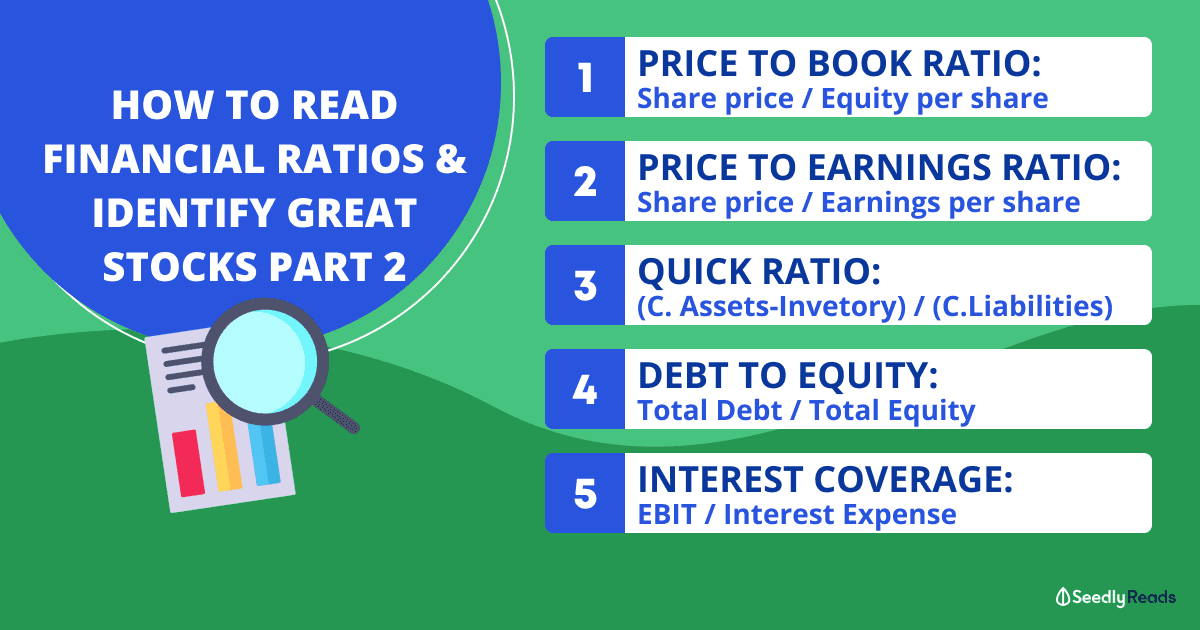
TL;DR: How to Analyse Financial Ratios Part 2: P/B and P/E Ratio & Liquidity Ratios

Price-to-Book (P/B) Ratio
P/B ratio = Share price/Equity per share
This is what you are paying compared to what the company is worth in their books. The benchmark can be taken to be 1 (what you are paying equals to the actual value of the company now) i.e you are paying a fair price.


Book value per share = 588,000,000 / 1,735,038,000 = 0.339
Using the current share price of Starhub of $1.49,
Starhub’s P/B ratio = 1.49 / 0.339 = 4.40
Comparatively, Singtel’s P/B ratio is around 1.8.
Price-to-Earnings (P/E) Ratio
P/E ratio = Share price/Earnings per share
This shows you the current prices as compared to their earnings per share.
You can actually take their earnings per share as stated.

But if you want to calculate, the formula is as follows:
Earnings per share = 193,800,000 / 1,735,038,000 = 11.2 cents
Starhub’s P/E ratio = 1.49 / 0.112 = 13.3
Comparatively, Singtel’s P/E ratio is around 17.7.
Just from this, it may seem like Starhub is a cheaper stock to buy. But is this the case? No. The P/E ratio being low may not always mean that it is a good buy!
FAQs
So what is a good P/E ratio?
Different industries have a different benchmark of what is high and low.
That is why we compare it with companies in the same industry.
Should we buy into a stock counter just for low P/E (or P/B) ratio?
You shouldn’t go into a stock just because it has a low P/E ratio! You may think you’ve found a treasure. But there may be underlying reasons why the stock is having a low P/E ratio.
It could be due to reasons like:
- Poor past performance
- Poor growth prospects
- The company could be in a bad financial situation
Although a low P/E ratio makes the stock attractive, do find out the reasons behind that before buying.
Should we ignore a stock just because it has a high P/E (or P/B) ratio?
Like I mentioned, different industries have a different benchmark of what is high. A P/E ratio of say, 30, may not be expensive if the growth of the company is good enough, or forecasted to be high enough to drive up the earnings of the company. (If their earnings increase, this will quickly bring the P/E ratio down.)
Liquidity Ratios
Quick Ratio
Quick ratio = (Current Assets – Inventory) / Current Liabilities
This ratio shows you the company’s ability to quickly fulfil its current liabilities (short-term obligations) with its liquid assets.

Quick ratio = (930.8 – 75.2) / 871.8 = 0.98
Not good since it is less than 1. This means in the event they need to pay off all their short-term obligations immediately, they can’t do so fully with their liquid assets.
Debt-to-Equity Ratio
Debt-to-Equity Ratio = Total Debt / Total Equity
This shows you the financial leverage or the percentage of the mode of financing of the company. A high D/E ratio brings about the concerns that the company may not pay off its debts in time.

Total debt = 50.1 + 978.4 = 1,028.5
D/E ratio = 1,028.5 / 588 = 175%
This is dangerous. They are highly leveraged.
Interest Coverage Ratio
Interest Coverage Ratio = Earnings before Interest and Taxes/Interest Expense
Interest coverage ratio shows how the company’s earnings (EBIT) is able to meet its interest expenses.

Operating profit is also referred to as earnings before interest and tax (EBIT).

EBIT = 273.5 m
Interest expense = 30.2m
Interest coverage ratio = 273.5 / 30.2 = 9.06x
In Summary
Price-to-Book (P/B) Ratio and Price-to-Earnings (P/E) Ratio are indications of market sentiments towards the company.
You can use these ratios to compare a company with its industry peers to see whether they are overvalued or undervalued.
Do note that altough these metrics can aid you, but they are not conclusive of whether a stock is good or bad.
Please do your own due diligence before investing.
Have Burning Questions Regarding Investing?
Why not check out the community at Seedly and participate in the lively discussion about investing!
Disclaimer: The information provided by Seedly serves as an educational piece and is not intended to be personalised investment advice. Readers should always do their own due diligence and consider their financial goals before investing in any stock.
Advertisement


