Robo Advisors Returns Revealed: StashAway, Endowus, Syfe, Kristal.AI and More!

Robo advisors and digital wealth management services have become increasingly popular among investors and for good reason.
They offer us ease of use, access to diversified portfolios, and automated, algorithm-driven investment decision-making, all at a relatively low cost.

But aside from all the nifty features that these digital platforms afford us, an investor’s main concern is ultimately portfolio performance.
Thus, we have taken the bold step and reached out to all robo advisors and digital wealth management services in Singapore for the past performances of their portfolios.
We hope that these findings will help you make a more well-informed personal finance decision when it comes to investing with a digital wealth platform.
Here’s what we found!
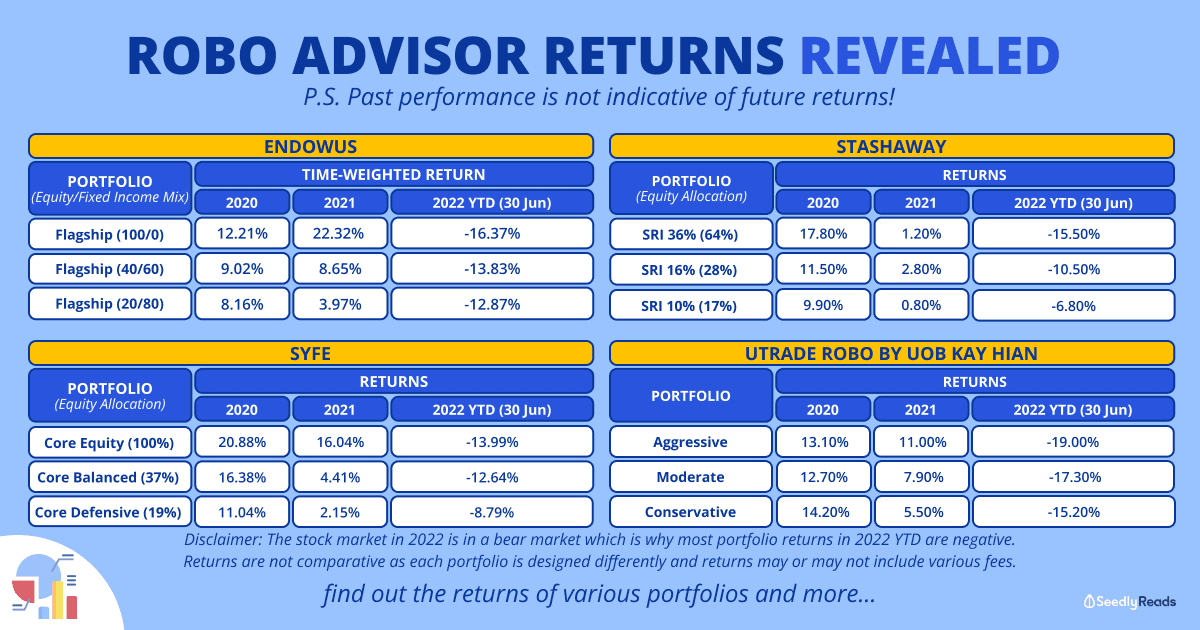
TL;DR: Robo Advisors Returns Revealed

While this article presents the past performance of various portfolios provided by robo advisors and digital wealth management services, investors should consider the portfolio allocation, risks, systems, features and fees of each platform before making a decision.
The returns shown in this article may or may not include fund-level fees/total expense ratio, platform/management fees and other fees. Thus the onus is on us investors to research and account for the costs of investing such as bid/ask spreads on ETFs, FX transaction costs, cash drag, potential withholding taxes, exchange and brokerage fees, and other charges that can make a significant difference in actual realised returns.
The returns shown here are reported by the companies themselves and may be different from actual returns.
Most importantly, remember that past performance is not indicative of future results.
Also, do note that these companies are listed in alphabetical order.
Jump to:
Disclaimer: This is a non-sponsored article. Do note that the information provided by Seedly serves as an educational piece and does not constitute an offer or solicitation to buy or sell any investment product(s). It does not take into account the specific investment objectives, financial situation or particular needs of any person. Readers should always do their own due diligence and consider their financial goals before investing in any investment product(s).
Endowus
![]()
History: Endowus was started in 2017 and is led by Samuel Rhee, former CEO and CIO of Morgan Stanley Investment Management Asia and Gregory Van, former Technology & Payments Lead at Grab.
Funding: US$23 million Series A funding led by Lightspeed Venture Partners with participation from SoftBank Ventures Asia. It has also received investments from strategic partners UBS AG, Samsung Ventures and Singtel Innov8.
Operation License: ENDOW.US PTE. LTD – holder of the Capital Markets Services (CMS) Licence by the Monetary Authority of Singapore (CMS license no. 101051), and is also an Exempt Financial Adviser under the Financial Advisors Act (Chapter 110) of Singapore.
Management Fees / Platform Fees/ Advisor Fees: All-in-access fee of 0.05% p.a. to 0.60% p.a.
Minimum Investment Amount to Start: S$1,000
Cash. CPF or SRS Investment Support: Cash, CPF, SRS.
Investment Methodology: Backed by the research of Nobel Laureate academics, Endowus advocates broadly diversified, passive and systematic strategies that have global market exposure with tilts towards the proven factors of returns such as value, size, and profitability. They partner with experts and leading global institutions such as Dimensional Fund Advisors (DFA) & PIMCO funds to access best-in-class financial solutions to achieve your goals.
Investment Portfolios:
| Investment Solutions | Category | Description |
|---|---|---|
| Core | Flagship | Grow your wealth by investing in globally diversified, best-in-class and low-cost funds. Maximise your returns at every risk level. |
| ESG | Invest in a better future with green and socially responsible funds from top ESG fund managers. | |
| Factors by Dimensional | Invest in globally diversified portfolios that utilise scientifically proven factors of expected returns to target better long-term performance. | |
| Satellite | Technology | Gain exposure to the world's most technologically innovative companies. |
| China Equities | Capture China's high growth potential by investing in its best companies listed onshore and offshore. | |
| China Fixed Income | Diversify via exposure to China's onshore and offshore corporate and government bonds. | |
| Global Real Estate | Invest in global real estate and infrastructure to earn high dividend income and capital appreciation. | |
| Megatrends | Get ahead of economic shifts and invest in future-driven themes like healthcare, clean energy, and AI. | |
| Low Volatility Fixed Income | Invest in a low-volatility portfolio that is more defensive than traditional fixed income. | |
| Cash Smart | Secure, Enhanced, Ultra | Earn more on your cash with Cash Smart solutions tailored to your risk tolerance. |
| Income | Stable Income | Enjoy steady monthly payouts and preserve your capital with lower risk. |
| Higher Income | Maximise your monthly payouts and grow your capital by taking more risk. | |
| Future Income | Earn some payouts and grow your capital for the life ahead by taking more risk. | |
| Fund Smart | - | A service where you can access a curated list of institutional funds to construct your portfolio and customise your fund allocations. |
Safety and Protection: All your assets are custodised in a trust account in your own name with UOB Kay Hian, one of Asia’s largest brokerage firms. UOB Kay Hian is regulated by the Monetary Authority of Singapore and has a Capital Markets Services License to provide custodial services for securities.
Endowus Portfolio Returns
Endowus includes Time-Weighted Returns (TWR) for all of their portfolios on their website. These returns include fund-level access fees but are NOT inclusive of Endowus Access Fees which range from 0.05 per cent to 0.60 per cent p.a.
In this article, we will only be displaying the TWR for their flagship portfolios. You may view the TWR for other portfolios under the respective portfolio pages on Endowus’ website.
Disclaimers
Endowus aims to provide the historical performance of the best proxy to a fund prior to the inception of the fund so as to capture a sufficiently long period to illustrate the past market cycles such as the 2008 Global Financial Crisis. The challenge Endowus encounters is that one fund may have several share classes with different inception dates, different fees, and different denomination currencies and even for the earliest share class it may not date back to the period that we aim to provide.
Endowus provides the representative cumulative historical performance in a table, including the yearly returns since the earliest available performance data, YTD, 1M, 6M, 3Y, 6Y and 10Y returns, and in a chart, which shows growth of capital using monthly performance data. The annualized 1Y, 3Y, 5Y, 10Y return is also presented. The performance data is computed on single pricing basis.
Therefore, Endowus’ best effort to closely match performance results for longer historical periods, is via using the following hierarchy of monthly returns data, moving down the list only when the higher priority data does not exist:
- Subscription share-class (the exact fund you are buying)
- Oldest share-class of the same fund vehicle, adjusted for currency and fund-level fees
- Oldest share-class of a different fund vehicle with a similar underlying fund strategy, where appropriate, adjusted for currency and fees.
- Prospectus benchmark, adjusted for currency and fund-level fees. Prospectus benchmark is the benchmark that the fund manager assigns to the fund and is usually aligned with the investment strategy of the fund.
- Alternative benchmark, adjusted for currency and fund-level fees. If the prospectus benchmark assigned by the fund manager is deemed unsuitable, we will assign an alternative benchmark that is broadly aligned with the investment strategy of the fund if possible. The alternative benchmark may be a single index or a blend of indices.
- Asset class benchmark, adjusted for currency and fund-level fees. If an alternative benchmark is required but cannot be identified, we will use an asset class benchmark that best illustrates the unit trust’s asset class exposure. The asset class benchmark may be a single index or a blend of indices.
In certain cases, Endowus’ Investment Office may choose to include multiple sources of monthly returns data according to the hierarchy set out above to illustrate the theoretical representative historical performance of the fund. Again, we reiterate that whilst we make every effort to provide clients with full transparency and use accurate and timely information, representative historical performance has its limitations and should not be relied upon on its own for financial decision making. Any investment views and investment products/services should be reviewed against a person’s investment experience, objectives, financial resources and personal circumstances. Further, although the data is taken from sources deemed reliable, we make no guarantee as to its accuracy, completeness or reliability.
How we calculate representative historical performance of a portfolio of funds
Representative historical performance of a portfolio of funds is calculated in the following steps:
- Combines the fund returns in their appropriate weight from their earliest common start date
- Runs the returns of the portfolio and includes threshold-breach based rebalancing if and when the portfolio would have materially drifted from the specified target asset allocation. Read more about rebalancing
While we believe this methodology results in a performance data that is most similar to the portfolio prior to its existence, it is not, and cannot be, completely precise.
Fees treatment
Portfolio performance includes fund-level fees and does not include Endowus Access Fees, which range from 0.05% to 0.60% per annum depending on investment objective, source of investment (CPF, SRS or Cash) and client assets under advice (“AUA”).
Data source
Endowus licenses the use of data from Intermediaries, including, in part, from Morningstar, a third-party provider of stock market data. Endowus makes no guarantee, representation or warranty and accepts no responsibility for the accuracy and/or completeness of the information. Where data is cited from Morningstar, the following disclosures apply: ©2021 The information, data, analyses and opinions (“Information”) contained herein: (1) include the proprietary information of Morningstar and its content providers; (2) may not be copied or redistributed except as specifically authorised; (3) do not constitute investment advice; (4) are provided solely for informational purposes; (5) are not warranted to be complete, accurate or timely; and (6) may be drawn from fund data published on various dates. Morningstar is not responsible for any trading decisions, damages or other losses related to the Information or its use. Please verify all of the Information before using it and don’t make any investment decision except upon the advice of a professional financial adviser. Past performance is no guarantee of future results. The value and income derived from investments may go down as well as up.
| Portfolio (Equity/Fixed Income Mix) | 2017 | 2018 | 2019 | 2020 | 2021 | 2022 YTD (31 May 2022) | 1H 2022 YTD (30 June 2022) |
|---|---|---|---|---|---|---|---|
| Endowus Core Flagship (100/0) | 14.84% | -8.7% | 23.63% | 12.21% | 22.32% | -9.50% | -16.37% |
| Endowus Core Flagship (80/20) | 13.2% | -7.05% | 20.94% | 10.79% | 17.91% | -9.39% | -15.67% |
| Endowus Core Flagship (60/40) | 11.48% | -5.1% | 17.56% | 9.91% | 13.34% | -9.28% | -14.80% |
| Endowus Core Flagship (40/60) | 9.62% | -3.88% | 15.06% | 9.02% | 8.65% | -9.17% | -13.83% |
| Endowus Core Flagship (20/80) | 7.87% | -2.05% | 12.08% | 8.16% | 3.97% | -9.05% | -12.87% |
| Endowus Core Flagship (0/100) | 6.12% | -0.62% | 9.56% | 7.08% | -0.54% | -8.94% | -12.11% |
Source: Endowus
Do note that Endowus’ Core Flagship portfolios were made available in 2018 and there was a change in the mix of their cash and SRS portfolios in 2020 to diversify and upgrade their exposure to Dimensional Fund Advisors, PIMCO’s institutional funds and a new Vanguard S&P500 index fund.
Kristal.AI

History: Founded by Asheesh Chanda and Vineeth Narasimhan in 2016; what started as an ambitious idea to democratize private banking is now present and thriving in Singapore, Hong Kong, India and Dubai, with users in 20+ countries. Kristal.AI is a private wealth platform for both affluent and retail investors. They offer Pre-IPOs, institutional funds, VC & PE funds in addition to algorithm-managed portfolios.
Funding: US$6M Series A funding led by Chiratae Ventures (formerly IDG Ventures India) – total funding amount stands at $9.1M.
Operation License: KRISTAL ADVISORS (SG) PTE. LTD. – MAS Capital Markets Services licensee (fund management) and Exempt Financial Advisor advising on investment products like Collective Investment Schemes, Securities, etc.
Management Fees / Platform Fees/ Advisor Fees:
Between 0% p.a. (up to US$10,000) to 0.30% p.a. (over US$10,000) of AUM for retail Kristal Freedom account.
US$1 + taxes per trade for US-listed ETFs
At Actuals for non-US-listed stocks (Charges charged by Saxo Capital Markets)
Minimum Investment Amount to Start: No minimum.
Cash. CPF or SRS Investment Support: Cash only
Investment Methodology: Kristal.AI combines the power of AI and human intelligence to create auto-balanced portfolios for investors who are time-poor or lack investing knowledge. It has four portfolios (KAIROs) designed for investors to suit their risk profiles. These are actively rebalanced to ensure that they are always aligned to the investor’s risk profile. The actual strength of KAIRO lies in its algorithm. While most robo advisors use algorithms on Modern Portfolio Theory (MPT), KAIRO uses GAIAA (Genetic Algorithm-based Iterative Asset Allocation) to create a portfolio with the highest probability of best returns within a defined risk range.
Investment Portfolios: Low-cost, auto-balanced portfolios comprising curated ETFs called Kristals or individual ETFs.
Risk-based portfolios
| Portfolio | Description |
|---|---|
| Kristal Secure | The Kristal Secure portfolio is a capital secure approach multi-asset ETF strategy completely driven by KAIRO algorithm. The objective is to have a capital protection approach as a priority with mild participation in equities for better alpha generation. A portfolio consists of stable equity ETFs, different duration fixed-income ETFs and commodity ETFs with automatically managing allocation between these asset classes based on constant market datapoint analysis and investment world macro analysis. It’s a managed low-risk strategy that defines the client’s risk profile and tries to keep the portfolio risk level at par or below the defined risk levels to maximize the risk-adjusted returns. It’s a core portfolio for long-term capital security without worrying about the market up and down moves. |
| Kristal Balanced | The Kristal balanced portfolio is a risk-managed multi-asset ETF strategy completely driven by the KAIRO algorithm. The objective is to have a safe & steady capital appreciation approach along with low volatility. A portfolio consists of core & low-volatile equity ETFs, fixed income ETFs, and commodity ETFs and has a higher allocation towards safer assets like gold and fixed income at any given point in time. It’s a low to moderate risk strategy that defines the client’s risk profile and tries to keep the portfolio risk level at par or below the defined risk levels to maximize the risk-adjusted returns with limited, defined equity exposure. It’s a balanced portfolio for low to moderate-risk investors looking for a balance between capital protection and capital growth. |
| Kristal Growth | The Kristal Growth portfolio is a growth-oriented multi-asset ETF strategy completely driven by the KAIRO algorithm. The objective is to have a capital appreciation approach along with low volatility. A portfolio consists of growth-oriented equity ETFs, fixed income ETFs and commodity ETFs with automatically managing allocation between these asset classes based on constant market datapoint analysis and investment world macro analysis. It’s a managed risk strategy that defines the client’s risk profile and tries to keep the portfolio risk level at par or below the defined risk levels to maximize the risk-adjusted returns. It’s a core portfolio for long-term wealth creation without worrying about the market up and down moves. |
| Kristal High Growth | The Kristal High Growth portfolio is an aggressively growth-oriented multi-asset ETF strategy completely driven by the KAIRO algorithm. The objective is to have an aggressive capital appreciation approach with being opportunists in managing volatility. A portfolio consists of growth-oriented equity ETFs, fixed income ETFs, and some portion of commodity ETFs to manage allocation between these asset classes based on constant market datapoint analysis and investment world macro analysis. It’s a managed risk strategy that defines the client’s risk appetite and tries to keep the portfolio risk level at par with client risk levels to maximize the risk-adjusted returns. It’s a core portfolio for long-term wealth creation without worrying about the market up and down moves with superior market volatility management. |
Aside from risk-based portfolios, investors can choose from investment products such as Pre-IPO & Private Assets, Institutional funds and more.
Safety and Protection: All client monies/assets managed by Kristal.AI are held in separate accounts in the respective client’s name and are not mixed up with the companies’ assets. All clients’ monies/assets are custodised in a trust account in your own name with Interactive Brokers and Saxo Capital Markets.
Kristal.AI Portfolio Returns
The inception date of these KAIRO baskets is November 2021. The returns marked with an asterisk are back-tested.
| Portfolio (Equity Allocation) | 2017 | 2018 | 2019 | 2020 | 2021 | 2022 YTD (31 May 2022) | 1H 2022 YTD (30 June 2022) |
|---|---|---|---|---|---|---|---|
| Kristal High Growth (41%) | 14.2%* | -0.54%* | 23.63%* | 29.25%* | 15.14%* | -15.82% | -22.33% |
| Kristal Growth (23%) | 13.76%* | -0.9%* | 22.13%* | 31.39%* | 14.97%* | -17.44% | -22.08% |
| Kristal Balanced (9%) | 10.66%* | -3.48%* | 14.74%* | 21.98%* | 9.87%* | -12.93% | -16.15% |
| Kristal Secure (7.5%) | 4.08%* | -3.22%* | 10.37%* | 11.43%* | 5.16%* | -9.47% | -12.71% |
With higher market volatility, Kristal.AI will lower the equity allocation in their portfolio and vice versa. As such, the latest rebalance (after 6 July 2022) will result in an equity allocation as follows:
- Kristal Secure – 30%
- Kristal Balance – 40%
- Kristal Growth – 56%
- Kristal High Growth – 71%
OCBC RoboInvest
![]()
History: OCBC RoboInvest is a collaboration between OCBC and a Fintech firm Planar Investments Pte Ltd (WeInvest).
Operation License: OVERSEA-CHINESE BANKING CORPORATION LIMITED
Management Fees / Platform Fees/ Advisor Fees: Portfolio management fee of 0.88% p.a. for AUM.
Minimum Investment Amount: US$100
Cash. CPF or SRS Investment Support: Cash only.
Investment Methodology: Investment portfolios are specially curated for you by OCBC’s leading wealth experts which includes funds such as Vanguard, iShares and Invesco. The portfolios are actively monitored and regularly rebalanced using a proprietary optimization algorithm.
Investment Portfolios: 37 portfolios across 6 markets for a range of risk appetites. Also, it is the only platform that allows investors to invest in individual stocks within the curated themes. Click here for the full rundown of portfolios available.
Safety and Protection: OCBC RoboInvest is created and delivered by OCBC, a trusted financial institution recognised for its stability and wealth management expertise.
OCBC RoboInvest Portfolio Returns
A majority of OCBC RoboInvest portfolios were incepted on 28 June 2018 and the returns shown here are the Extended Internal Rate of Return (XIRR). Back-tested data will be marked with an asterisk.
Risk-based Portfolios
These portfolios include equities, fixed income, commodities and cash components.
| Portfolio (Equity Allocation) | Currency | 2017 | 2018 | 2019 | 2020 | 2021 | 2022 YTD (31 May 2022) |
|---|---|---|---|---|---|---|---|
| Aggressive (68.9%) | USD | 21.44%* | -6.56%* | 24.26% | 20.53% | 11.41% | -13.61% |
| Growth (64.0%) | USD | 20.21%* | -6.97%* | 23.15% | 17.97% | 10.48% | -13.58% |
| Balanced (49.3%) | USD | 16.24%* | -4.93%* | 20.08% | 16.13% | 7.59% | -12.11% |
| All Weather (24.6%) | USD | 10.89%* | -1.51%* | 16.51% | 16.65% | 4.51% | -9.17% |
| Cautious (34.5%) | USD | 11.61%* | -2.67%* | 16.10% | 12.92% | 5.34% | -10.68% |
| Defensive (19.7%) | USD | 8.45%* | -1.70%* | 13.43% | 11.41% | 2.37% | -9.22% |
Thematic Portfolios
| Portfolio | Currency | 2017 | 2018 | 2019 | 2020 | 2021 | 2022 YTD (31 May 2022) |
|---|---|---|---|---|---|---|---|
| Asia Tech | USD | 83.37%* | -25.42%* | 22.60%* | 92.65%* | -7.36% | -19.50% |
| Australian Financials | AUD | 20.59%* | -6.91%* | 11.22% | -1.33% | 28.25% | -6.17% |
| Australian REITS | AUD | 7.30%* | 11.26%* | 20.90% | -3.05% | 25.24% | -11.37% |
| China Growth | USD | 65.14%* | -28.05%* | 33.63%* | 54.47%* | -23.34% | -20.21% |
| Cloud Computing | USD | 59.77%* | 34.31%* | 44.36%* | 93.15%* | -5.17% | -37.01% |
| Dogs of The Dow | USD | 6.53%* | 3.73%* | 19.37% | -1.24% | 17.25% | 6.43% |
| Future World | USD | 48.47%* | -5.01%* | 36.58%* | 72.05%* | 1.75% | -30.88% |
| Gen Z Winners | USD | 59.83%* | -4.46%* | 37.46%* | 102.62%* | -11.89% | -34.36% |
| Hong Kong Consumer | HKD | 39.36%* | -19.93%* | 19.30% | 74.28% | -13.91% | -10.87% |
| Hong Kong Technology | HKD | 67.49%* | -19.49%* | 45.96% | 75.15% | 18.42% | -6.62% |
| Impact Investing | USD | 21.62%* | -6.49%* | 33.12%* | 23.05%* | 23.29% | -14.14% |
| Mainland Europe Financials | EUR | 12.40%* | -13.42%* | 39.60% | -17.03% | 37.74% | -8.06% |
| Mainland Europe Healthcare | EUR | 9.58%* | -19.61%* | 25.74% | 17.58% | 20.96% | -16.34% |
| Mainland European Technology | EUR | 41.65%* | -21.01%* | 40.74% | -12.27% | 36.03% | -18.59% |
| Precious Metals | USD | 21.62%* | 1.65%* | 26.74%* | 25.87%* | -9.61% | 0.24% |
| Resurgent Industrials | USD | 20.96%* | -14.27%* | 29.17% | 14.70% | 29.92% | -13.64% |
| Singapore Cash is King | SGD | 30.74%* | -12.79%* | 17.96% | -8.53% | 10.65% | 3.96% |
| Singapore Stable REITS | SGD | 26.38%* | -2.38%* | 28.86% | -6.46% | 9.34% | -2.81% |
| Stable Aussie Giants | AUD | 3.46%* | -3.87%* | 24.04% | 2% | 15.81% | 0.31% |
| Stable Singapore Giants | SGD | 16.88%* | -5.17%* | 26.64% | -16.99% | 14.52% | 0.82% |
| Stable US Consumer Giants | USD | 13.12%* | -7.90%* | 32.91% | 8.93% | 21.37% | 4.43% |
| Stable US Giants | USD | 10.23%* | 3.79%* | 29.35% | 9.74% | 17.12% | 6.73% |
| Stable US Healthcare Giants | USD | 31.47%* | 15.15%* | 19.99% | 7.38% | 21.62% | -0.60% |
| Stable US Industrial Giants | USD | 33.01%* | -9.47%* | 33.62% | 11.44% | 28.88% | -8.13% |
| UK Financials | GBP | 24.72%* | -5.60%* | 7.86% | -6.31% | 6.97% | -8.56% |
| US Financials | USD | 16.09%* | -16.90%* | 32.39% | -10.77% | 41.96% | 3.34% |
| US Tech Leaders | USD | 40.12%* | -0.38%* | 42.22% | 34.63% | 26.59% | -21.14% |
| Yummy | USD | 11.64%* | -8.71%* | 25.70% | 10.95% | 10.93% | 1.79% |
| Cyber Security | USD | - | 7.17%* | 31.42%* | 19.91%* | 26.66%* | -8.09% |
| Electric Vehicle | USD | - | -15.76%* | 45.36%* | 162.84%* | 26.23%* | -23.81% |
| Metaverse | USD | - | 2.88%* | 54.51%* | 54.95%* | 33.04%* | -22.58%* |
SquirrelSave
![]()
History: SquirrelSave is led by Victor Lye, a Corporate entrepreneur with over 25 years of cross-industry experience in investments, insurance and healthcare.
Operation License: PIVOT FINTECH PTE. LTD. – MAS Capital Markets Services licensee (fund management) and Exempt Financial Advisor advising on investment products and issuing or promulgating on investment products like Collective Investment Schemes, Securities, etc.
Management Fees / Platform Fees/ Advisor Fees: 0.50% p.a. (Management Fee) + 10% of any positive return (Performance Fee)
Minimum Investment Amount: No minimum
Cash. CPF or SRS Investment Support: Cash only.
Investment Methodology:
SquirelSave (SS) is a fully automated digital portfolio management system driven by supervised Machine Learning (ML) and data-driven AI techniques. At SquirrelSave, all investment tasks are carried out by our supervised AI algorithms, including market analysis, portfolio construction & rebalancing decisions, investor risk/return goal optimization, etc.
At SquirrelSave, portfolio rebalancing (Tactical Asset Allocation (TAA)) decisions are founded on an advanced behavioural finance approach called Prospect Theory (PT), which is dynamically integrated into our Strategic Asset Allocation (SAA) portfolios. These are constructed by applying the principle of “survival of the fittest” using enhanced refinements to Markowitz Modern Portfolio Theory (MPT).
As an AI-driven digital investment management company, we constantly review and scrutinise our AI algorithms to seek viable ways to improve our portfolios’ performance by channeling our expertise in financial asset volatility research and deep overall experience in the financial industry.
Safety and Protection: Your money and investment assets are kept entirely separate from SquirrelSave’s operating finances and assets. Your Global ETF Portfolio(s) underlying ETF and cash investments are held by Saxo Capital Markets as the custodian. Your money deposited with SquirrelSave is received and held by UOB Bank Singapore as the custodian. Therefore, you will always have full access and claim to your cash and investment assets if SquirrelSave closes down, gets acquired, goes public or whatever happens.
SquirrelSave Portfolio Returns
Unlike others, SquirrelSave does not group you into risk-labelled historical model portfolios and uses a forward-looking portfolio to match your risk profile instead.
Hence, the data below is taken from their reference portfolios and shows data based on the percentage of equity allocation in each portfolio.
Disclaimers
All SquirrelSave reference portfolio returns shown are inclusive of ETF expense ratios and net of SquirrelSave management fees. SquirrelSave uses Artificial Intelligence (AI) to design and manage diversified investment portfolios for each investor. Because SquirrelSave is not an investment fund, there is no single return measure. Instead, every SquirrelSave investor has his/her own investment performance as each investor is managed separately by our SquirrelSave AI. As investors can withdraw and top-up any time, investment returns will be affected by individual investor decisions. Hence, SquirrelSave uses reference portfolios which are actual portfolios managed on an ongoing basis, without any interference with withdrawals or top-ups, to measure investment performance.
The contents herein are provided by PIVOT Fintech Pte. Ltd. (“PIVOT”), as owner and operator of SquirrelSave, which is a consumer brand of PIVOT; for informational purposes only and do not constitute an offer to sell or the solicitation of any offer to buy or sell any securities to any person in any jurisdiction. No reliance should be placed on the information or herein or accuracy or completeness, for any purpose whatsoever. No representation, warranty or undertaking, express or implied, is given as to the information herein or accuracy or completeness, and no liability is accepted as to the foregoing. Past performance is not necessarily indicative of future results. All investments carry risk and all investment decisions of an individual remain the responsibility of that individual. Investors are advised to fully understand all risks associated with any kind of investing they choose to do. Unless specifically noted otherwise, all return examples provided are based on hypothetical or simulated investing. We make no representations or warranties that any investor will, or is likely to, achieve profits similar to those shown, because hypothetical or simulated performance is not necessarily indicative of future results.
| Portfolio (Equity/Fixed Income Mix) | 2020 | 2021 | 2022 YTD (31 May 2022) |
|---|---|---|---|
| SquirrelSave (90/10) | 17.30% | 24.80% | -16.20% |
| SquirrelSave (80/20) | 4.20% | 21.80% | -12.30% |
| SquirrelSave (60/40) | 1.30% | 17.50% | -8.50% |
| SquirrelSave (40/60) | 7% | 15.40% | -5.10% |
| SquirrelSave (30/70) | 4.70% | 13.50% | -2.50% |
Do note that SquirrelSave was incepted in June 2019 and that there was an initial period of adoption of their AI algorithm beta version in 2020 before a subsequent enhancement from 2021 onwards.
StashAway
![]()
History: StashAway was founded in 2016 by ex-ZALORA Group CEO, Michele Ferrario, ex-Nomura MD, Freddy Lim, and CTO Nino Ulsamer. Currently, StashAway operates in Singapore, Malaysia, Hong Kong, Thailand, and MENA.
Funding: $58.3 million USD in five funding rounds, with the latest Series D round being led by Indian Venture Capitalist firm Sequoia Capital India. In January 2021, StashAway surpassed $1 billion USD ($1.36 billion SGD) in assets under management (AUM).
Operating License: StashAway operates under Asia Wealth Platform Pte. Ltd. and has a MAS Capital Market Services License – fund management and dealing in capital markets products, and Exempt Financial Advisor which allows StashAway to advise on investment products, and issue or promote investment products like Collective Investment Schemes, Securities, etc.
Management Fees / Platform Fees/ Advisor Fees: StashAway’s management fees range from 0.2% to 0.8% based on an investor’s total Asset Under Management (AUM). Investors pay less the more they invest with StashAway.
Minimum Investment Amount: No minimum.
Cash, CPF or SRS Investment Support: Cash and SRS.
Investment Methodology: StashAway constructs portfolios based on varying levels of risk exposure. Its General Investing portfolios, Responsible Investing portfolios, and Thematic portfolios are guided by ERAA® (Economic Regime-based Asset Allocation). ERAA® is a portfolio management strategy that addresses external economic forces. These economic forces ultimately drive asset class’ returns, volatility, and correlations. ERAA® has four pillars that, together, minimises risk and maximises returns for personalised portfolios across any economic environment. These four pillars are:
- Regime-based asset allocation
- Risk control
- Valuation gaps
- Managing asset-specific risk
StashAway also offers an Income portfolio. The Income portfolio is an SGD-denominated and SGX-traded portfolio and helps to diversify investors’ income sources and asset classes to earn both income and capital appreciation. StashAway also offers Simple, an ultra-low risk cash management portfolio, and Flexible portfolios, which are customisable portfolios that allow investors to pick their desired asset classes.
StashAway SRI Portfolio Allocations
| %/SRI | 36% | 26% | 22% | 16% | 10% | 6.50% |
|---|---|---|---|---|---|---|
| International Equities | 25.00% | 24.00% | 25.00% | 11.00% | 6.00% | 4.00% |
| US Equities | 39.00% | 28.00% | 22.00% | 17.00% | 11.00% | 4.00% |
| Government Bonds | 8.00% | 23.00% | 25.00% | 33.00% | 41.00% | 37.00% |
| Corporate Bonds | - | 3.00% | 8.00% | 18.00% | 30.00% | 30.00% |
| Real Estate | 15.00% | 9.00% | 8.00% | 8.00% | - | - |
| Commodities | 12.00% | 12.00% | 12.00% | 12.00% | 12.00% | 12.00% |
| Cash | 1.00% | 1.00% | 1.00% | 1.00% | 1.00% | 13.00% |
Safety and Protection: Investors’ money is kept entirely separate from StashAway’s finances. StashAway uses custodian banks that hold investors’ money, whether it’s in cash or in securities.
StashAway has made it a top priority to work with global, reputable banks for these purposes. StashAway’s custodian bank for receiving investors’ deposits is DBS Bank. For deposits into Simple, Saxo Capital Markets Pte Ltd or Lion Global holds the custodian accounts for investors’ investable cash and securities.
In these custodian institutions, investors’ assets are always in a segregated account– one that is separate from StashAway’s operations and assets. This means that investors will always have full access and claim to their assets no matter what happens to StashAway.
StashAway Portfolio Returns
StashAway uses the “StashAway Risk Index” for their general investing portfolios. If the SRI is at 20% for example, there is a 99% chance that this portfolio will not lose more than 20% of its value in any given year.
To calculate the potential loss of a portfolio in a year, they use Value-at-Risk (VaR). At StashAway, they use a 99%-VaR, meaning a portfolio has a 99% probability of not losing more than a given percentage of assets in a year.
Disclaimers
Our same-risk benchmarks are proxied by MSCI World Equity Index (for equities) and FTSE World Government Bond Index (for bonds). The benchmarks we use have the same 10-years realised volatility as our portfolios.
Model portfolio returns are expressed in gross term before fees, withholding taxes, and reclaims on dividends. They are provided only as a gauge of pure performance before other items.
Actual account returns may deviate from the model portfolios due to differences in the timing of trade execution (e.g. during the day vs close), timing differences and intraday volatility of reoptimisation and re-balancing, fees, dividend taxes and reclaims, etc. All returns are in SGD terms.
The inception date for portfolios with SRI 6.5%, 8%, 10%, 12%, 14%, 16%, 18%, and 20% is 19 July 2017; the inception date for portfolios with SRIs of 26%, 30%, and 36% is 16 August 2018; the inception date for the portfolio with SRI 22% is 15 August 2019.
Past performance is not a guarantee for future returns. Before investing, investors should carefully consider investment objectives, risks, charges and expenses, and if need be, seek independent professional advice.
We would like to bring your attention to a simulation error that we uncovered in February 2022. The simulation error does not affect the ‘live’ returns of your accounts in the App and Web App and will only result in a revision of some of the model portfolio results. This has since been rectified.
Our investment framework’s goal isn’t to beat the markets every day. In fact, depending on how much risk you decide to take, you’ll likely still experience short-term volatility at times. But, through those bumps, your StashAway portfolios can recover more quickly compared to investments with the same risk level that don’t maximise returns. The end result? The opportunity for less painful drawdowns in the short term, and stronger performance in the medium to long term.
| Portfolio (StashAway Risk Index) | 2019 | 2020 | 2021 | 2022 YTD (31 May 2022) | 1H 2022 YTD (30 June 2022) |
|---|---|---|---|---|---|
| SRI 36% | 31.40% | 17.80% | 1.20% | -9.30% | -15.50% |
| SRI 26% | 24.00% | 15.20% | 4.60% | -7.20% | -12.50% |
| SRI 22% | 15.60% | 14.10% | 3.90% | -7.20% | -11.70% |
| SRI 16% | 19.40% | 11.50% | 2.80% | -6.70% | -10.50% |
| SRI 10% | 17.70% | 9.90% | 0.80% | -3.90% | -6.80% |
| SRI 6.5% | 12.90% | 3.60% | -1.30% | -6.90% | -8.60% |
Syfe
![]()
History: Syfe is a digital wealth manager licensed by the Monetary Authority of Singapore for retail fund management. The company was founded back in 2017 by Chief Executive Officer (CEO) Dhruv Arora. Arora was a former director at UBS and also founded Grofers: an Indian online grocery delivery service backed by Softbank and Sequoia.
Funding: Backed by Unbound, MPGI, Valar Ventures, David Rogers and Paul Redbourn
Operation License: SYFE PTE. LTD. – MAS Capital Markets Services licensee (fund management) and Exempt Financial Advisor advising on investment products and issuing or promulgating for Collective Investment Schemes.
Management Fees / Platform Fees/ Advisor Fees: 0.65% (first S$20,000) – 0.4% ($100,000) based on your total AUM with Syfe. You will pay less the more you invest with Syfe. Also, for anything above $500,000, the rate will vary.
Minimum Investment Amount: No minimum
Cash. CPF or SRS Investment Support: Cash only
Investment Methodology: Syfe takes a dynamic, risk-based approach to your portfolio’s asset allocation to deliver better returns.
Syfe leverages smart beta: a rules-based and systematic strategy that enhances long-term returns, reduces volatility, and improves diversification. Current factors include growth and value, minimum volatility, US and international exposure.
Portfolios are re-optimised every six months, maintaining stable strategic asset allocation. Re-optimisation process aims to maximise expected long term risk-adjusted returns and address price and factor drifts.
Investment Portfolio:
Equity100 (100% equities portfolio): Smart Beta strategy, which uses an advanced multi-factor model to deliver better risk-adjusted returns than market-cap-weighted benchmarks.
Syfe Core portfolio: Allows you to invest in a blend of equity, bonds and gold Exchange Traded Funds (ETFs). Asset Class Risk Budgeting approach maximises expected return for each risk level while keeping asset allocation stable.
REIT+ Portfolio: Access to the largest and most tradeable REITs in Singapore. Syfe’s new REIT+ portfolio is the first investment offering to closely replicate the performance of the SGX iEdge S-REIT Leaders Index.
Thematic portfolios such as ESG and Clean Energy, Disruptive Technology, etc.
Safety and Protection:
When you transfer money to Syfe, your deposits are held in a Trust Account at DBS, kept separate from Syfe’s own accounts, and invested only in your portfolio assets.
All assets bought on your behalf are held with Saxo Markets, whose sub-custodians are Citibank for securities and HSBC for any un-invested cash.
However, your funds are held in a co-mingled account i.e. your funds are mixed with the funds of other users of the platform. On balance, Syfe keeps a detailed ledger of the names of their investors and the amount of securities under their name.
Syfe Portfolio Returns
Syfe includes portfolio returns for all of their portfolios on their website.
In this article, we will only be displaying the past returns for their core portfolios. You may view the past returns for other portfolios under the respective portfolio pages on Syfe’s website.
Disclaimers
Source: Syfe internal backtested data, BlackRock, Invesco, Vanguard and StateStreet.
Note that past returns are not a guarantee for future performance.
| Portfolio (Equity Allocation) | 2018 | 2019 | 2020 | 2021 | 2022 YTD (31 May 2022) | 1H 2022 YTD (30 June 2022) |
|---|---|---|---|---|---|---|
| Core Equity 100 (100%) | -2.36% | 28.75% | 20.88% | 16.04% | -11.39% | -13.99% |
| Core Growth (69.5%) | -3.81% | 22.34% | 20.05% | 9.46% | -11.43% | -13.36% |
| Core Balanced (37%) | -1.82% | 17.04% | 16.38% | 4.41% | -11.43% | -12.64% |
| Core Defensive (19%) | 0.67% | 11.57% | 11.04% | 2.15% | -8.32% | -8.79% |
UTRADE Robo by UOB Kay Hian

History: UTRADE Robo is a digital fund manager providing customised portfolios to suit the investment objectives of their clients. This robo advisor was launched by UOB Kay Hian: one of Asia’s largest brokerage firms, and backed by the UOB group.
Operation License: UOB KAY HIAN PTE. LTD. – MAS Capital Markets Services licensee (fund management) and Exempt Financial Advisor advising on investment products and issuing or promulgating on investment products like Collective Investment Schemes, Securities, etc.
Management Fees / Platform Fees/ Advisor Fees: 0.88% p.a. (first S$50,000) – 0.5% p.a. (AUM >S$100,000) depending on your investment amount.
Minimum Investment Amount: S$5,000 per portfolio
Cash. CPF or SRS Investment Support: Cash only.
Investment Methodology: Automated fund management service that maximises investment return for each client’s risk profile, which is determined by their financial objective and risk profile.
Investment Portfolios available: Globally diversified multi-asset portfolios built using low-cost ETFs that grant access to 11,000 stocks and bonds.
UTRADE Robo Portfolio Returns
Note that these portfolios are incepted on 6th September 2018 and there are no back-tested data prior. The equity and fixed income allocations for these portfolios are not fixed but equity allocation is generally higher for higher-risk portfolios.
| Portfolio | 2019 | 2020 | 2021 | 2022 YTD (31May 2022) | 1H 2022 YTD (30 June 2022) |
|---|---|---|---|---|---|
| Aggressive | 17.90% | 13.10% | 11.00% | -11.50% | -19.00% |
| Moderate | 17.20% | 12.70% | 7.90% | -11.60% | -17.30% |
| Conservative | 12.10% | 14.20% | 5.50% | -10.70% | -15.20% |
Conclusion
Once again, these returns data are given directly by the robo advisors and digital wealth management services themselves. If you are interested, you may also check out a “Robo-war experiment” opinion piece by one of our Seedly Community members to give you further insights about the performance of some robo advisor portfolios.
Remember that returns are only one aspect of choosing the right robo advisor or digital wealth management service. So be sure to read more about them in the following articles or read reviews from users on SeedlyReviews before coming to a conclusion:

Related Articles
Advertisement


