Is Singapore Rich? Here’s How Wealthy People in Singapore Are Compared to the Rest of the World
 Joel Koh
●
Feeling rich?
Well, if you are living in Singapore, you should be.

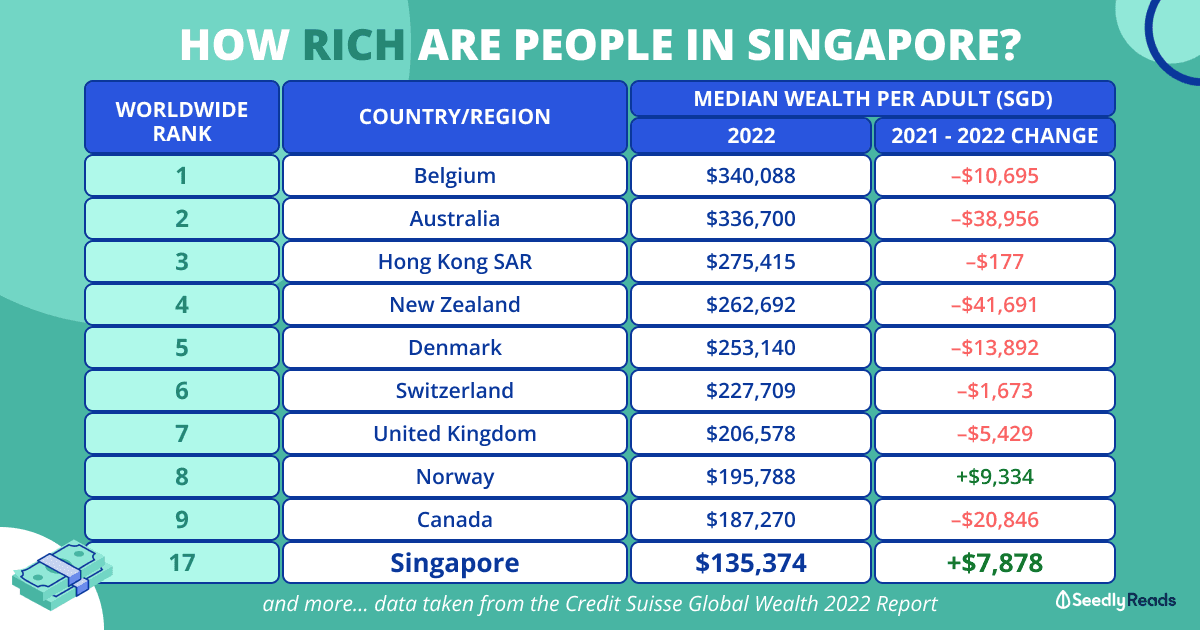
According to the UBS & Credit Suisse Global Wealth Report 2023, published in August 2023, Singapore is the eighth richest country in the world, with an average wealth per adult of S$521,448 (US$382,960) as of end-2022.
This amount has grown more than threefold since 2000, as the average wealth per adult in Singapore then was just S$158,141 (US$114,720).
However, the median wealth per adult of S$135,374 (US$99,490) puts Singapore as the seventeenth richest country in the world.
The study, currently in its fourteenth year of publishing, examines 5.4 billion individuals worldwide, spanning various economic backgrounds, ranging from billionaires, millionaires to those in the middle and lower income brackets.
In an absolute sense, people in Singapore are richer than most other countries in the world.
But there’s more to this than meets the eye.
Here is what you need to know!
TL;DR: How Wealthy Are Singaporeans?
Median wealth per adult (USD)
Market 2022 Change 2021–22
Belgium $340,088 –$10,695
Australia $336,700 –$38,956
Hong Kong SAR $275,415 –$177
New Zealand $262,692 –$41,691
Denmark $253,140 –$13,892
Switzerland $227,709 –$1,673
United Kingdom $206,578 –$5,429
Norway $195,788 +$9,334
Canada $187,270 –$20,846
France $181,165 –$9,635
Netherlands $153,012 –$42,486
Taiwan $147,297 –$5,062
United States $146,603 +$19,678
Spain $146,290 +$231
Italy $146,031 –$9,662
Japan $141,078 –$18,317
Singapore $135,374 +$7,878
Korea $126,165 –$13,921
Ireland $123,471 –$4,967
Qatar $122,818 +$5,090
Source: UBS
Do note that information and exchange rates are accurate as of Thursday, 17 August 2023.
UBS & Credit Suisse Global Wealth Report 2023 Methodology
Before we begin, you must know how this report was put together:
Net worth or “wealth” is defined as the value of financial assets plus real assets (principally housing) owned by households, minus their debts. This corresponds to the balance sheet that a household might draw up, listing the items that are owned and their net value if sold. Private pension fund assets are included, but not entitlements to state pensions (i.e. CPF is not included). Human capital is excluded altogether, along with assets and debts owned by the state (which cannot easily be assigned to individuals).
Valuations refer to year-end values and are usually expressed in terms of US dollars using end-period exchange rates. However, to control for short-term fluctuations in exchange rates we sometimes use “smoothed exchange rates” which refer to 2021 USD exchange rates adjusted for the difference in the country’s inflation rate relative to the USA (this adjustment avoids extreme USD valuations being recorded for high inflation countries in the past.)
For convenience, the researchers disregard the relatively small amount of wealth owned by children on their own account and frame our results in terms of the global adult population, which totaled 5.4 billion in 2022. The “Asia-Pacific” region excludes China and India, which are treated separately due to the size of their populations.
In addition, this annual report by Swiss banks UBS and Credit Suisse uses the US dollar to make it easy to compare different economies.
Keep this in mind as you read the article.
How Rich Are People in Singapore?
Here are the statistics.
Median Wealth Per Adult in Singapore
Median wealth per adult (USD)
Market 2022 Change 2021–22
Belgium $340,088 –$10,695
Australia $336,700 –$38,956
Hong Kong SAR $275,415 –$177
New Zealand $262,692 –$41,691
Denmark $253,140 –$13,892
Switzerland $227,709 –$1,673
United Kingdom $206,578 –$5,429
Norway $195,788 +$9,334
Canada $187,270 –$20,846
France $181,165 –$9,635
Netherlands $153,012 –$42,486
Taiwan $147,297 –$5,062
United States $146,603 +$19,678
Spain $146,290 +$231
Italy $146,031 –$9,662
Japan $141,078 –$18,317
Singapore $135,374 +$7,878
Korea $126,165 –$13,921
Ireland $123,471 –$4,967
Qatar $122,818 +$5,090
Source: UBS
We should focus on the median wealth per adult, which is the middle value and a superior norm measure.
Unlike the mean, the highest values and lowest values do not skew the median as much. This occurs because, unlike mean wealth, it remains unaffected by outliers, such as households with extremely high or extremely low incomes.

Despite the COVID-19 pandemic, the total net household wealth in Singapore increased by 7.2 per cent in 2022 to S$2.59 trillion (US$1.906 trillion).
Whereas the average household’s wealth per adult went up by 6.3 per cent.
Singapore’s increasing wealth bucks worldwide trends, as the global net household wealth fell 2.4 per cent to S$618.5 trillion (US$454.4 trillion) in 2022. Whereas the wealth per adult fell by 3.6 per cent.
Breakdown of Household Wealth in Singapore
Financial assets account for over half of personal wealth in Singapore from 56.3% per cent of gross assets in Singapore at the end of 2022.
Here is a further breakdown according to the Singapore Department of Statistics Household Sector Balance Sheet (Assets) for the First Quarter (Q2) 2022:

Why Don’t We Feel Rich in Singapore?
So here is the million-dollar question.
Why don’t we feel rich in Singapore?
Well, I would boil it down to three main factors.
Wealth Inequality in Singapore
Firstly, wealth inequality in Singapore is a thing.
Let’s look at how Singapore compares to its developed nation Asian peers like Japan, Korea and Taiwan:
Macroeconomic Indicators 2022
Japan Korea Singapore Taiwan (Chinese Taipei)
Population 125 million 51 million 6 million 24 million
Adult population 105 million 43 million 5 million 20 million
Gross Domestic Product (GDP) US$39,638 per adult US$39,594 per adult US$90,086 per adult US$38,464 per adult
Mean wealth US$216,078 per adult US$230,760 per adult US$382,957 per adult US$273,788 per adult
Median wealth US$103,681 per adult US$92,719 per adult US$99,488 per adult US$108,247 per adult
Total wealth US$22.6 trillion US$9.9 trillion US$1.9 trillion US$5.4 trillion
US dollar millionaires 2,757,000 1,254,000 332,000 765,000
Belong to the top 10% of global wealth holders 41,983,000 18,559,000 1,951,000 8,674,000
Belong to the top 1% of global wealth holders 2,409,000 1,106,000 299,000 680,000
Most notably, for the amount of wealth that the top 1% hold, Japan’s richest held 18.9% of the wealth, Korea’s super wealthy held 22.3% of the wealth, while Taiwan’s (Chinese Taipei) tycoons owned 26.0% of the wealth at the end of 2022.
In contrast, Singapore’s top 1% owns about 34.1% of the wealth at the end of 2022:

If you are wondering why there is this discrepancy, the relatively hefty inheritance taxes that Korea and Japan have played a part.
As Singapore is small in size, the higher wealth inequality can be attributed to a small, unrepresentative group of high net-worth individuals (HNW).
In 2022, the number of millionaires in Singapore increased by 10.3% (31,003 individuals) compared to 2021, reaching a total of 332,000 individuals. However, the number of millionaires worldwide dropped to 59.4 million millionaires.
High Cost of Living in Singapore (For Expatriates)
Not to mention the high cost of living in Singapore.
According to the yearly Economist Intelligence Unit (EIU) Worldwide Cost of Living Surveys, Singapore was the most expensive city for eight times in the past decade:

But here’s the thing, the survey is geared towards expatriates with a more atas (Malay for expensive) consumption basket:

Also, the survey does not consider the various grants and subsidies given primarily to Singapore Citizens and Permanent Residents who earn less, as an article by Channel News Asia points out:
After adjusting for government transfers and taxes, the Gini coefficient in 2022 is 0.378, the second lowest on record.
The Gini coefficient, a measure of income inequality, is equal to zero in the case of total income equality; a value of one means total inequality.
This is as government transfers rose in 2022, with resident households getting S$5,765 per household member on average in 2022.
This was higher than the $5,257 received in 2021, due to support measures to cushion the impact of the GST rate hike and inflation.
Those staying in HDB 1- & 2-room flats continued to receive the most government subsidies, at S$12,189 per household member on average.
Safe to say, I think we do not feel rich in Singapore as the cost of living for expatriates (read: more atas lifestyle) is much higher.
Sure, you can get more value-for-money options, but the expensive things are much more expensive.
Wealth on Paper ≠ Financial Independence
So here’s the thing.
Even if you are a professional with one of the highest-paying jobs in Singapore:

and a sizeable amount of funds and investments set aside for retirement, your net worth can take a hit if your expenditure is high and you lose your job.
This is probably why even those earning quite a bit don’t feel rich, as losing their job could mean that their lifestyle might be in jeopardy.
To be truly wealthy, you should be financially independent.
| Level | Stage | Definition |
|---|---|---|
| 5 | Financial Freedom | Your passive income from wealth assets cover current living expenses + your life goals |
| 4 | FINANCIAL INDEPENDENCE | Your passive income from wealth assets cover current living expenses |
| 3 | Financial Security | Your passive income from wealth assets covers basic living needs (water, utilities, bills) |
| 2 | Financial Stability | You have emergency fund savings of 6 months |
| 1 | Financial Dependencce | Debt Payments consume you, and is more than your own Income |
Being too dependent on your job for income can lead to feelings of financial insecurity, which the rich do not have to worry about.
Read More
Advertisement


