What Singaporeans Need to Know About Temasek’s Portfolio Performance 2020

Update: Temasek’s Portfolio Performance
Temasek has just announced that it closed the financial year ended 31 March 2020 with a Net Portfolio Value (NPV) of S$306 billion. This value is the same as its preliminary portfolio performance.
Here are some take away from this announcement.
Portfolio Value of S$306 Billion

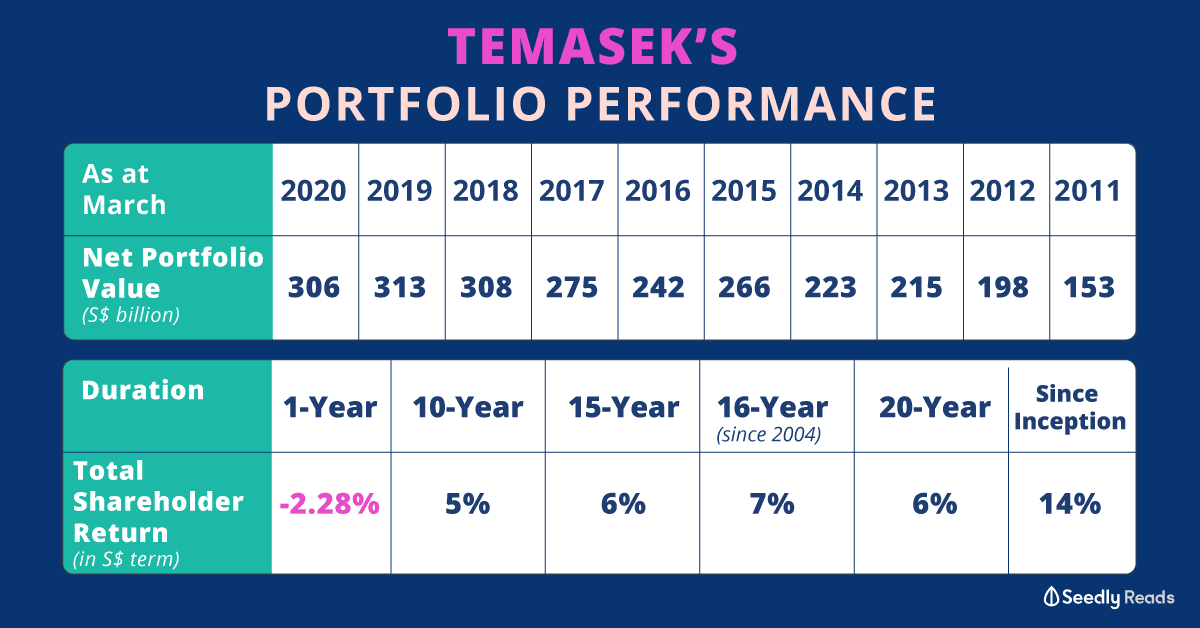
Temasek reports a net portfolio value (NPV) of S$306 billion as at 31 March 2020.
We see a slight decrease in One-Year Total Shareholder Return (TSR) of 2.28%, which seems reasonable for such a climate. Most people would have expected a worse result.
Do note that TSR takes into account all dividends distributed to the shareholder, less any capital injections. The Total Shareholder Return since 1974 was an annualised return of 14% compounded over 46 years; 20-year TSR was 6%, and 10-year TSR was 5%.
During the year, Temasek
- Invested S$32 billion
- Divested S$26 billion
Over the last 16 years
If we zoom out to have a longer-term view on this, Temasek’s net portfolio value (NPV) tripled over the last 16 years. From S$90 billion as at 31 March 2004.
Shareholders have also enjoyed a compounded return of 7.5% from 31 March 2004 to 31 March 2020.
Temasek Portfolio vs Indexes Around the World
To give a better comparison of the performance of Temasek Portfolio, we take a look at the performance over the last financial year.
| Portfolio/ Indices | Performance over the last financial year |
|---|---|
| Temasek Portfolio | -2.3% |
| MSCI World Index | -5.8% |
| MSCI Asia ex-Japan Index | -9.0% |
| MSCI Singapore Index | -18.3% |
Temasek’s Net Portfolio Value (NPV) Over the Years
Here’s the Net Portfolio Value (NPV) of Temasek over the past 10 years:
| As at March | Net Portfolio Value |
|---|---|
| 2020 | S$306 Billion |
| 2019 | S$313 Billion |
| 2018 | S$308 Billion |
| 2017 | S$275 Billion |
| 2016 | S$242 Billion |
| 2015 | S$266 Billion |
| 2014 | S$223 Billion |
| 2013 | S$215 Billion |
| 2012 | S$198 Billion |
| 2011 | S$193 Billion |
Temasek’s Total Share Return as of 31 March 2020
Here’s the Total Shareholder Return:
| Duration | TSR in S$ terms |
|---|---|
| Since inception (1974) | 14% |
| 20-year | 6% |
| 16-year (since 2004) | 7% |
| 15-year | 6% |
| 10-year | 5% |
| One-year | -2.28% |

Overall, Temasek’s portfolio has been quite resilient to crises as compared to some of the indexes in terms of past performance. While past performances do not necessarily depict future performances, we thought the track record seems rather healthy.
There are definitely things we can learn from the way Temasek invests.
Advertisement


