$10,000 Dividend Income Per Month: Here's How Much You Need To Invest!

Your 5Cs Singaporean Dream? Outdated.
Forget the typical 5Cs (car, cash, credit card, condominium and country club membership) that were commonly used to determine how successful Singaporeans were in life.
Allow me to present to you the cold hard truth.
The new Singaporean Dream is… TO SURVIVE!

With crazy car prices, expensive property prices (don’t even need to look at condos), rising food prices…
A Singaporean’s evolved goal in life is to generate enough passive income and retire early.
How?
One of the many ways is to build a dividend income portfolio and take one step closer to achieving financial freedom!
TL;DR: How Much Do You Need to Invest to Have a Sustainable Dividend Income Portfolio?

Jump to:
- What Is a Dividend Income Portfolio?
- How Much Should You Be Investing?
- How Much Does Your Portfolio Need to Be?
- Some Examples of Share Counters and Their Dividend Yields
What Is a Dividend Income Portfolio?
What exactly is a dividend income portfolio, and what is all the hype about?
Dividend stocks are stocks that give dividend payouts based on their profits over the year. Should an investor invest in a dividend stock, he receives income in the form of dividends given out by the stock.

Imagine this: Your stock portfolio gives you enough every year to a point where you no longer have to depend on your salary for your expenses.
That is the goal of every investor, and this is how you can build a dividend income portfolio:
- Certain stocks give dividend payouts based on their profits over the year.
- Investors can use their preferred method to identify and screen out solid stocks and investment instruments to invest in.
- From there, investors will build their investment portfolios.
- The objective is to build an investment portfolio which can cover your expenses.
- Once that objective is achieved, financial freedom may not be too far away!
Dividend Investing – How Much Should You Be Investing?
Before you start building your portfolio, it’s important to understand what exactly dividend investing is all about.
And you’ll need to identify how much you want your investment portfolio to fetch you every month.
Here are some of the numbers we used for a better estimation of the amount needed:
- Basic monthly expenses for Singaporeans after retirement are $1,379 per month (based on a 2019 study).
- The average household spend on goods and services in Singapore is $4,906 per month (based on a 2018 survey).
| Monthly Dividend | Total dividend required per year |
|---|---|
| $500 | $6,000 |
| $1,000 | $12,000 |
| $1,379 (Monthly expenses for Singaporeans after retirement) | $16,548 |
| $2,000 | $24,000 |
| $4,906 (Average household spend per month) | $58,872 |
| $5,000 | $60,000 |
| $10,000 | $120,000 |
| $12,000 | $144,000 |
With the total dividend we aim to achieve annually in mind, we worked backwards to find out the percentage of dividend yield and the size of the portfolio needed.
What is the Dividend Yield?
The dividend yield is the percentage of a company’s dividend compared to its share price.
It can be calculated using:
Dividend Yield = (Annual Dividend)/ Share Price * 100%
How Much Does Your Portfolio Need to Be?
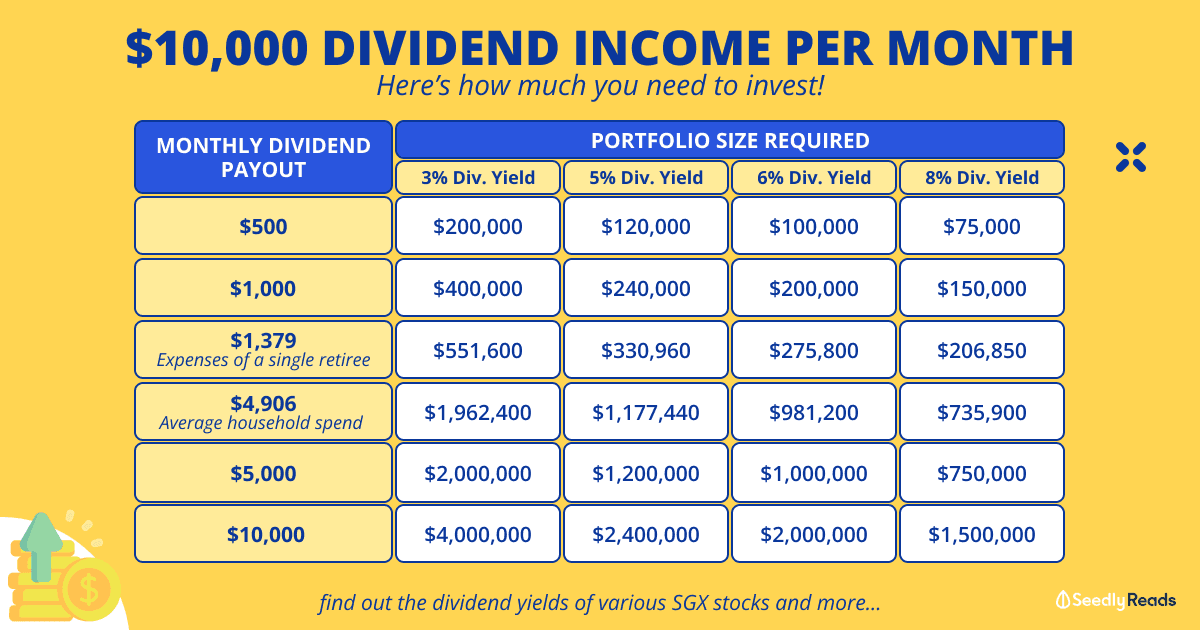
For better illustration, we’re looking at a dividend yield of at least 3%.
Anything below the interest rate of the Singapore Savings Bond (SSB) makes no sense for the risk that you will be taking.
| Total dividend required per year | Portfolio size with X% dividend yield | ||||
|---|---|---|---|---|---|
| 3% | 5% | 6% | 7% | 8% | |
| $6,000 | $200,000 | $120,000 | $100,000 | $85,714.29 | $75,000 |
| $12,000 | $400,000 | $240,000 | $200,000 | $171,428.57 | $150,000 |
| $16,548 (Monthly expenses for Singaporeans after retirement) | $551,600 | $330,960 | $275,800 | $236,400 | $206,850 |
| $24,000 | $800,000 | $480,000 | $400,000 | $342,857.14 | $300,000 |
| $58,872 (Average household spend) | $1,962,400 | $1,177,440 | $981,200 | $841,028.57 | $735,900 |
| $60,000 | $2,000,000 | $1,200,000 | $1,000,000 | $857,142.86 | $750,000 |
| $120,000 | $4,000,000 | $2,400,000 | $2,000,000 | $1,714,285.71 | $1,500,000 |
| $144,000 | $4,800,000 | $2,880,000 | $2,400,000 | $2,057,142.86 | $1,800,000 |
Few things to take note of, when it comes to dividend investing:
- A company with the highest dividend yield may not necessarily be the safest investment.
- The above demonstrates that to achieve that amount of dividend, you need to have a good amount of savings first.
- You’ll have to take into account the effects of inflation on your future expenditure, which has been rising rapidly in recent months.
- The faster you manage to achieve the above where your dividend yield income exceeds your expenses, the sooner you will achieve financial freedom!
Seriously, we cannot emphasise enough the importance of starting early and making use of the power of compounding to achieve financial freedom faster.

However, do not chase dividend yields as it alone is not the best indicator of whether you should add a particular stock or share counter to your portfolio.
Not all high dividend-paying stocks are good investments.
It is important to understand why they can pay such high dividends, and whether these dividends are sustainable for the companies as well.
As with any form of investment, you need to do your due diligence before putting your hard-earned money in.
Once you’ve done your homework, you’ll then be able to start building your portfolio to give yourself a headstart towards early retirement.
Aside from your dividend income, don’t forget that you would also have CPF LIFE to supplement your retirement income. So do consider that as a part of your portfolio as well!
Some Examples of Share Counters and Their Dividend Yields
The total dividend yield of your portfolio depends on the amount one invests in each stock and the dividend yield of these stocks.
To list down some of the stocks and their dividend yield.
Note: data is correct as of 4 July 2024.
For stocks in SGX with a dividend yield of 3-4%:
| Trading Name | Code | Last Price | P/E | Yield (%) |
|---|---|---|---|---|
| AVJennings A$ | A05 | 0.27 | 14.98 | 3.33 |
| Azeus | BBW | 10.3 | 20.95 | 3.27 |
| Banyan Tree | B58 | 0.39 | 10.55 | 3.12 |
| Brook Crompton | AWC | 0.57 | 4.85 | 3.51 |
| China Aviation | G92 | 0.87 | 9.32 | 3.13 |
| ChinaSunsine | QES | 0.39 | 5.41 | 3.85 |
| Duty Free Intl | 5SO | 0.075 | 22.92 | 3.31 |
| Ever Glory | ZKX | 0.42 | 3.17 | |
| Far East Orchard | O10 | 1 | 7.38 | 4 |
| First Sponsor | ADN | 1.08 | 112.62 | 3.89 |
| Global Inv | B73 | 0.112 | 20.14 | 3.57 |
| Hong Leong Asia | H22 | 0.595 | 6.85 | 3.36 |
| Hyphens Pharma | 1J5 | 0.28 | 10.11 | 3.96 |
| InnoTek | M14 | 0.55 | 27.32 | 3.64 |
| KingsmenCreative | 5MZ | 0.27 | 18.37 | 3.85 |
| Micro-Mechanics | 5DD | 1.57 | 27.29 | 3.85 |
| MoneyMax Fin | 5WJ | 0.255 | 4.97 | 3.92 |
| MTQ | M05 | 0.305 | 7.3 | 3.17 |
| Oiltek | HQU | 0.475 | 12.1 | 3.44 |
| ParkwayLife Reit | C2PU | 3.55 | 21.26 | 3.71 |
| PEC | IX2 | 0.515 | 14.5 | 3.88 |
| Penguin Intl | BTM | 0.88 | 11.57 | 3.89 |
| PSC Corporation | DM0 | 0.33 | 8.3 | 3.94 |
| Sakae | 5DO | 0.126 | 41.58 | 3.97 |
| SGX | S68 | 9.62 | 18.27 | 3.56 |
| SIA Engineering | S59 | 2.35 | 27.18 | 3.42 |
| SingHoldings | 5IC | 0.325 | 16.36 | 3.08 |
| Singtel | Z74 | 2.9 | 59.46 | 3.7 |
| Sinostar Pec | C9Q | 0.129 | 1.59 | 3.88 |
| Spura Finance | S23 | 0.66 | 17.01 | 3.03 |
| ST Engineering | S63 | 4.31 | 22.81 | 3.74 |
| Straco | S85 | 0.47 | 15.66 | 3.19 |
| Tuan Sing | T24 | 0.215 | 55.14 | 3.18 |
| Valuetronics | BN2 | 0.67 | 9.62 | 3.46 |
| Wong Fong Ind | 1A1 | 0.158 | 10.08 | 3.8 |
| Yeo Hiap Seng | Y03 | 0.54 | 49.09 | 3.7 |
| Zheneng Jinjiang | BWM | 0.385 | 10.66 | 3.38 |
For stocks in SGX with a dividend yield of 4-5%:
| Trading Name | Code | Last Price | P/E | Yield (%) |
|---|---|---|---|---|
| AnnAik | A52 | 0.062 | 5.6 | 4.84 |
| AP Oil | 5AU | 0.116 | 36.48 | 4.31 |
| CapitaLandInvest | 9CI | 2.71 | 75.86 | 4.48 |
| CapLand IntCom T | C38U | 1.97 | 15.22 | 4.57 |
| Captii | AWV | 0.29 | 4.31 | |
| Centurion | OU8 | 0.585 | 3.21 | 4.27 |
| ComfortDelGro | C52 | 1.35 | 16.08 | 4.97 |
| CosmoSteel | B9S | 0.103 | 4.85 | |
| CreditBureauAsia | TCU | 0.88 | 20.48 | 4.23 |
| DBS | D05 | 37.94 | 10.79 | 5.01 |
| DFIRG USD | D01 | 1.89 | 78.64 | 4.28 |
| Econ Healthcare | EHG | 0.199 | 8.11 | 4.32 |
| EnGro | S44 | 0.71 | 4.23 | |
| First Resources | EB5 | 1.37 | 10.89 | 4.53 |
| Frasers Cpt Tr | J69U | 2.13 | 19.93 | 4.77 |
| Genting Sing | G13 | 0.845 | 16.78 | 4.12 |
| GuocoLand | F17 | 1.47 | 8.35 | 4.08 |
| Hafary | 5VS | 0.355 | 3.91 | 4.23 |
| Haw Par | H02 | 9.87 | 10.08 | 4.06 |
| Hock Lian Seng | J2T | 0.305 | 5.78 | 5 |
| IFS Capital | I49 | 0.11 | 12.09 | 4.55 |
| ISEC | 40T | 0.39 | 17.5 | 4.13 |
| Japan Foods | 5OI | 0.275 | 4.73 | |
| Keppel DC Reit | AJBU | 1.83 | 26.56 | 4.77 |
| LHT | BEI | 1.06 | 12.99 | 4.72 |
| Metro | M01 | 0.485 | 27.32 | 4.17 |
| PanUnited | P52 | 0.55 | 10.56 | 4.26 |
| RE&S Hldg | 1G1 | 0.355 | 27.71 | 4.23 |
| SBS Transit | S61 | 2.47 | 11.06 | 4.56 |
| Sheng Siong | OV8 | 1.48 | 16.28 | 4.22 |
| SingShipping | S19 | 0.245 | 7.96 | 4.08 |
| Sri Trang Agro | NC2 | 0.77 | 4.78 | |
| Sri Trang Gloves | STG | 0.35 | 173.12 | 4.95 |
| ThaiBev | Y92 | 0.445 | 11.18 | 4.63 |
| Tye Soon | BFU | 0.31 | 6.36 | 4.11 |
| UMS | 558 | 1.19 | 13.3 | 4.87 |
| Union Gas | 1F2 | 0.365 | 8.73 | 4.05 |
| VICOM Ltd | WJP | 1.31 | 16.96 | 4.17 |
| Vicplas Intl | 569 | 0.104 | 27.66 | 4.33 |
For stocks in SGX with a dividend yield of 5-6%:
| Trading Name | Code | Last Price | P/E | Yield (%) |
|---|---|---|---|---|
| Audience | 1AZ | 0.325 | 11.86 | 5.23 |
| BH Global | BQN | 0.126 | 10.94 | 5.56 |
| Boustead | F9D | 1.03 | 7.66 | 5.34 |
| BRC Asia | BEC | 2.26 | 6.91 | 5.2 |
| Civmec | P9D | 0.85 | 7.94 | 5.67 |
| Combine Will | N0Z | 0.875 | 3.83 | 5.71 |
| DBS | D05 | 37.94 | 10.79 | 5.01 |
| Delfi | P34 | 0.875 | 8.48 | 5.82 |
| Ellipsiz | BIX | 0.181 | 5.52 | |
| F & N | F99 | 1.07 | 10.34 | 5.29 |
| Food Empire | F03 | 0.975 | 6.75 | 5.15 |
| Frasers Property | TQ5 | 0.79 | 5.73 | |
| Geo Energy Res | RE4 | 0.29 | 5.15 | 5.86 |
| GP Industries | G20 | 0.495 | 5.05 | |
| Hai Leck | BLH | 0.38 | 14.94 | 5.13 |
| Hiap Tong | 5PO | 0.087 | 6.83 | 5.56 |
| Hock Lian Seng | J2T | 0.305 | 5.78 | 5 |
| Hong Leong Fin | S41 | 2.42 | 7.82 | 5.12 |
| Hosen | 5EV | 0.037 | 12.17 | 5.41 |
| HRnetGroup | CHZ | 0.685 | 10.63 | 5.84 |
| Huationg Global | 41B | 0.158 | 1.96 | 5.06 |
| Jumbo | 42R | 0.255 | 10.48 | 5.88 |
| Keppel | BN4 | 6.53 | 13.17 | 5.26 |
| Low Keng Huat | F1E | 0.295 | 5.08 | |
| Lum Chang | L19 | 0.295 | 5.08 | |
| MSC | NPW | 0.775 | 16.27 | 5.32 |
| Nordic | MR7 | 0.295 | 7.38 | 5.39 |
| OCBC Bank | O39 | 15.05 | 9.69 | 5.47 |
| Ossia Intl | O08 | 0.151 | 5.83 | 5.92 |
| Reclaims Global | NEX | 0.2 | 17.27 | 6 |
| Riverstone | AP4 | 0.97 | 20.35 | 5.62 |
| Sheffield Green | SGR | 0.198 | 10.83 | 5.05 |
| Shopper360 | 1F0 | 0.094 | 4.39 | 5.32 |
| StarHub | CC3 | 1.24 | 15.17 | 5.4 |
| Straits Trading | S20 | 1.38 | 5.93 | |
| TalkMed | 5G3 | 0.395 | 16.35 | 5.57 |
| TCIL HK$ | T15 | 1.36 | 9.34 | 5.77 |
| TheHourGlass | AGS | 1.55 | 6.45 | 5.19 |
| Uni-Asia Grp | CHJ | 0.785 | 9.09 | 5.61 |
| UOB | U11 | 32.5 | 9.69 | 5.27 |
| ValueMax | T6I | 0.41 | 5.84 | 5.37 |
| Venture | V03 | 14.2 | 15.37 | 5.27 |
| Wilmar Intl | F34 | 3.12 | 9.43 | 5.45 |
| CDL HTrust | J85 | 0.96 | 9.73 | 5.14 |
| Far East HTrust | Q5T | 0.625 | 9.59 | 5.54 |
| Frasers HTrust | ACV | 0.42 | 9.19 | 5.08 |
| Kep Infra Tr | A7RU | 0.465 | 22.52 | 5.63 |
| DigiCore Reit USD | DCRU | 0.605 | 5.81 | |
| Mapletree Ind Tr | ME8U | 2.11 | 52.76 | 5.61 |
| PARAGONREIT | SK6U | 0.85 | 17.82 | 5.61 |
| Suntec Reit | T82U | 1.07 | 18.14 | 5.51 |
For stocks in SGX with a dividend yield of 6-7%:
| Trading Name | Code | Last Price | P/E | Yield (%) |
|---|---|---|---|---|
| Tai Sin Electric | 500 | 0.395 | 15.01 | 6.18 |
| Tung Lok Rest | 540 | 0.121 | 16.2 | 6.36 |
| CSE Global | 544 | 0.4 | 10.78 | 6.96 |
| APAC Realty | CLN | 0.4 | 11.92 | 6.33 |
| Asia Enterprises | A55 | 0.143 | 8.05 | 6.99 |
| Aspial Lifestyle | 5UF | 0.124 | 9.29 | 6.19 |
| Avi-Tech Hldg | 1R6 | 0.27 | 11.33 | 6.48 |
| Ban Leong | B26 | 0.345 | 5.2 | 6.47 |
| Bumitama Agri | P8Z | 0.705 | 6.08 | 6.87 |
| Choo Chiang | 42E | 0.395 | 7.78 | 6.58 |
| Chuan Hup | C33 | 0.165 | 23.67 | 6.1 |
| HC Surgical | 1B1 | 0.28 | 9.75 | 6.07 |
| HongkongLand USD | H78 | 3.23 | 6.88 | |
| Jardine C&C | C07 | 26.13 | 6.26 | 6.11 |
| Jason Marine | 5PF | 0.114 | 129.55 | 6.58 |
| JMH USD | J36 | 35.29 | 14.74 | 6.45 |
| Kimly | 1D0 | 0.315 | 11.08 | 6.73 |
| KSH | ER0 | 0.24 | 6.25 | |
| LHN | 41O | 0.33 | 9.35 | 6.06 |
| NeraTel | N01 | 0.078 | 5.04 | 6.33 |
| Niks Prof | NPL | 0.151 | 11.64 | 6.62 |
| Olam Group | VC2 | 1.15 | 15.85 | 6.09 |
| Overseas Edu | RQ1 | 0.2 | 12.23 | 6.57 |
| PNE Industries | BDA | 0.45 | 29.57 | 6.67 |
| QAF | Q01 | 0.81 | 16.95 | 6.17 |
| SIA | C6L | 7.02 | 7.69 | 6.95 |
| SIIC Environment | BHK | 0.162 | 4.02 | 6.51 |
| Sing Inv & Fin | S35 | 1 | 7.08 | 6.03 |
| Stamford Tyres | S29 | 0.21 | 14.08 | 6.98 |
| Tat Seng Pkg | T12 | 0.75 | 6.13 | 6.12 |
| Thakral | AWI | 0.61 | 9.54 | 6.56 |
| TIH | T55 | 0.164 | 6.1 | |
| TJ DaRenTang USD | T14 | 2.21 | 13.09 | 6.89 |
| UOB Kay Hian | U10 | 1.35 | 7.09 | 6.81 |
| YHI Intl | BPF | 0.465 | 10.35 | 6.77 |
| YZJ Fin Hldg | YF8 | 0.345 | 6.3 | 6.38 |
| CapLand India T | CY6U | 1.02 | 8.15 | 6.45 |
| NetLink NBN Tr | CJLU | 0.825 | 31.53 | 6.35 |
| AIMS APAC Reit | O5RU | 1.25 | 23.26 | 6.47 |
| Keppel Reit | K71U | 0.85 | 19.08 | 6.27 |
| Lendlease Reit | JYEU | 0.56 | 18.17 | 6.49 |
| Mapletree Log Tr | M44U | 1.29 | 20.93 | 6.53 |
| Mapletree PanAsia Com Tr | N2IU | 1.24 | 11.08 | 6.45 |
| OUEREIT | TS0U | 0.265 | 7.78 | 6.8 |
| StarhillGbl Reit | P40U | 0.485 | 54.01 | 6.64 |
For stocks in SGX with a dividend yield of 7-8%:
| Trading Name | Code | Last Price | P/E | Yield (%) |
|---|---|---|---|---|
| Bund Center | BTE | 0.365 | 26.72 | 7.67 |
| HG Metal | BTG | 0.32 | 46.88 | 7.94 |
| Hotung Inv | BLS | 1.45 | 34.16 | 7.32 |
| New Toyo | N08 | 0.27 | 9.26 | 7.04 |
| PropNex | OYY | 0.84 | 12.85 | 7.23 |
| SUTL Enterprise | BHU | 0.7 | 7.51 | 7.14 |
| UOA | EH5 | 0.46 | 10.93 | 7.34 |
| EC World Reit | BWCU | 0.28 | 7.33 | |
| Frasers L&C Tr | BUOU | 0.94 | 7.36 | |
| Sabana Reit | M1GU | 0.325 | 19.84 | 7.05 |
If you’re wondering how we got the above information, we used the Singapore Exchange Limited’s Stock Screener and sorted the information with the ‘Dividend Yield’ filter.

Have some tips on tricks to building your own dividend income portfolio? Head over to the Seedly Community to discuss!

Related Articles
Advertisement


